
Right to Work Benefits Fact Sheet — Fall 2026
Download the full .pdf file of the Right to Work Benefits Fact Sheet for Fall 2026.
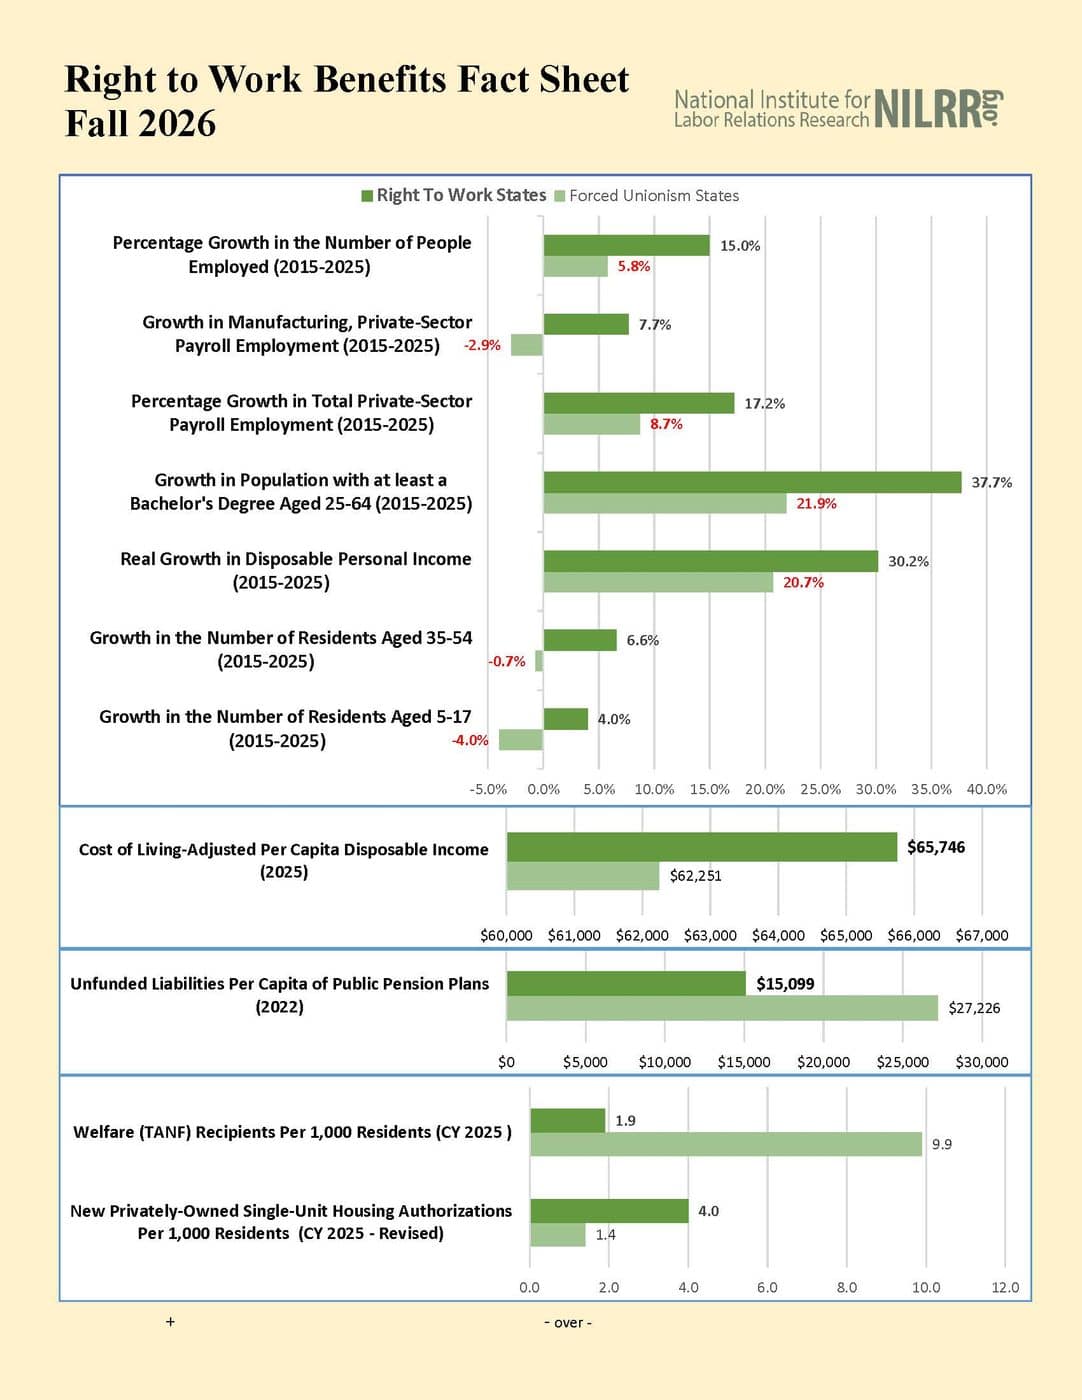
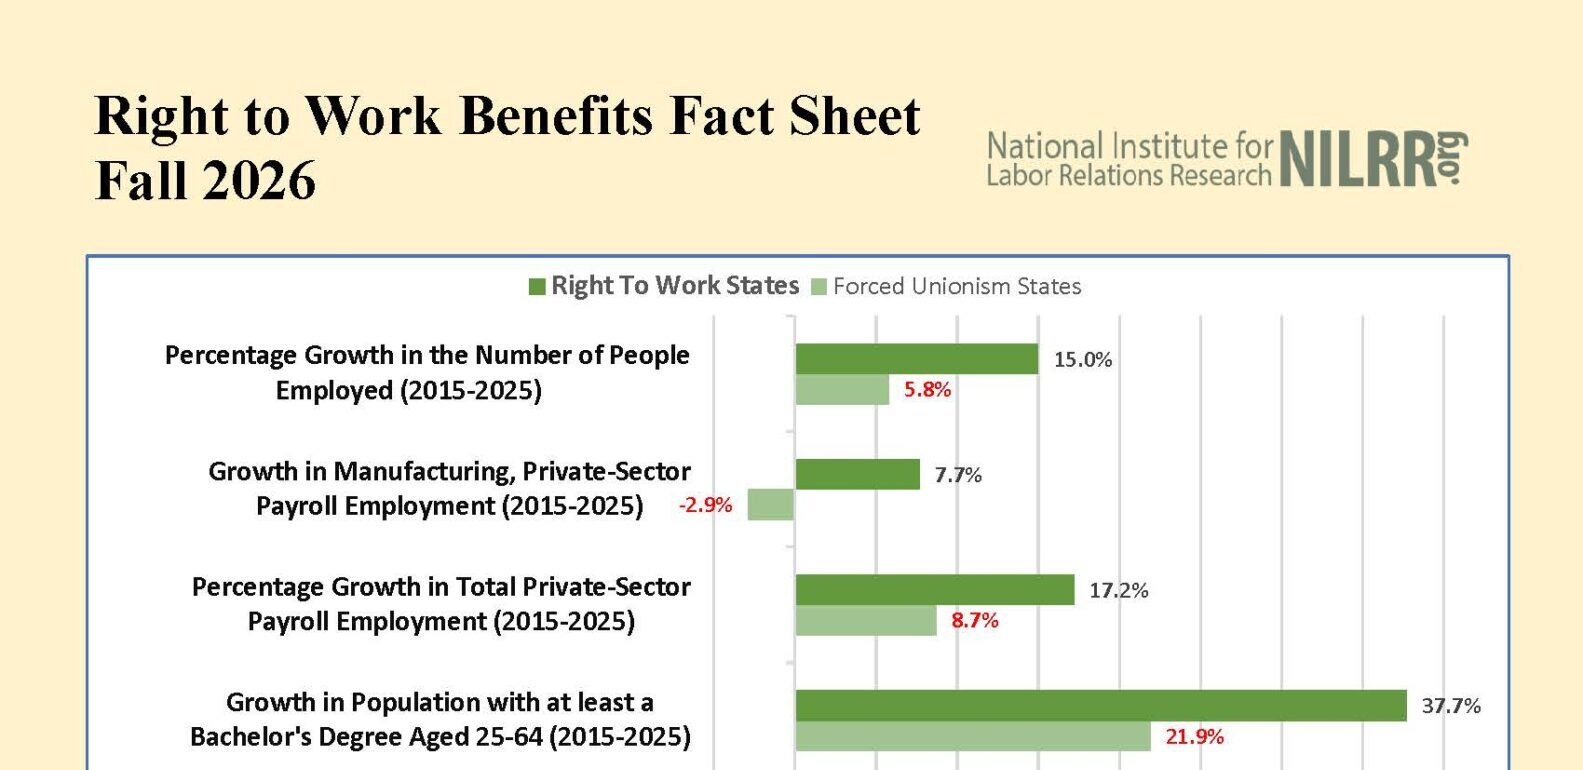
Economic growth trends from 2015 to 2025 show that Right to Work states consistently continue to outperform Forced Unionism states across several key indicators:
- Employment Growth
- Right to Work states saw a 15.0% increase in the Number of People Employed, compared to just 5.8% in Forced Unionism states.
- Manufacturing and Private-Sector Payroll Employment grew by 7.7% in Right to Work states versus 2.9% in Forced Unionism states.
- Total Private-Sector Payroll Employment rose by 17.2% in Right to Work states, while Forced Unionism states experienced an 8.7% increase.
- Population and Education
- The Population Aged 25-64 with at least a Bachelor’s Degree grew by 37.7% in Right to Work states, compared to 21.9% in Forced Unionism states.
- The Number of Residents Aged 35-54 increased by 30.2% in Right to Work states, versus 20.7% in Forced Unionism states.
- The Number of Residents Aged 5-17 declined by 0.7% in Right to Work states, but dropped more sharply (by 4.0%) in Forced Unionism states.
- Income and Consumption
- Real Growth in Disposable Personal Income was 6.6% in Right to Work states, compared to 4.0% in Forced Unionism states.
- Cost-of-Living-Adjusted per Capita Disposable Income in 2025 was $65,746 in Right to Work states, higher than $62,251 in Forced Unionism states.
Overall, Right to Work states continue to demonstrate stronger economic and demographic growth, higher income gains, and more favorable employment trends over the decade.