Right to Work Benefits Fact Sheet – Autumn 2022

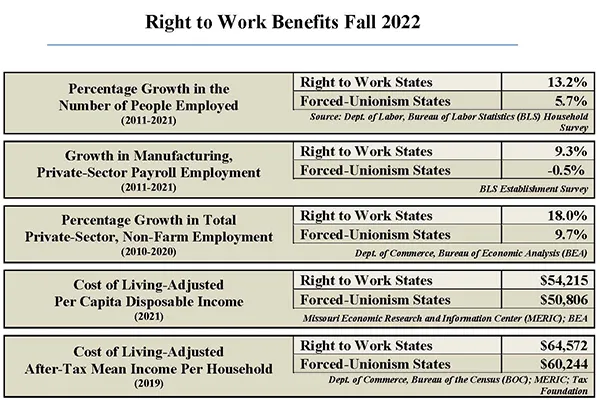
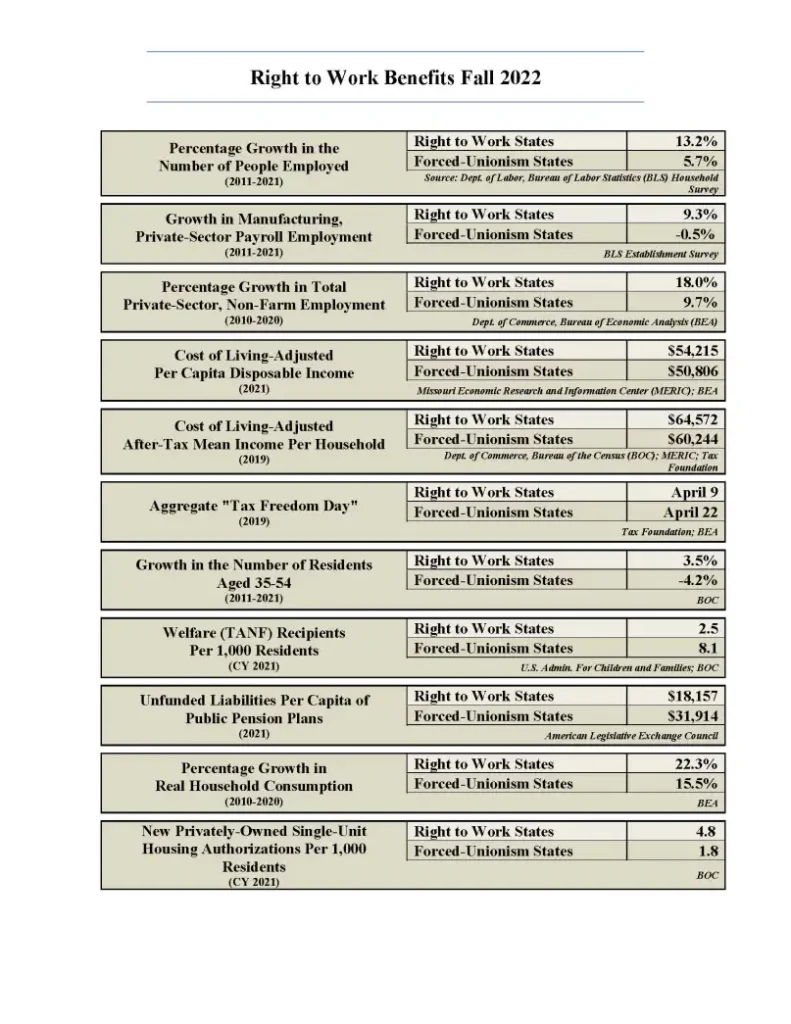
Percentage Growth in the Number of People Employed (2011-2021)
Right to Work States 13.2%
Forced-Unionism States 5.7%
Source: Dept. of Labor, Bureau of Labor Statistics (BLS) Household Survey
Growth in Manufacturing, Private-Sector Payroll Employment (2011-2021)
Right to Work States 9.3%
Forced-Unionism States -0.5%
Source: BLS Establishment Survey
Percentage Growth in Total Private-Sector, Non-Farm Employment (2010-2020)
Right to Work States 18.0%
Forced-Unionism States 9.7%
Source: Dept. of Commerce, Bureau of Economic Analysis (BEA)
Cost of Living-Adjusted Per Capita Disposable Income (2021)
Right to Work States $54,215
Forced-Unionism States $50,806
Source: Missouri Economic Research and Information Center (MERIC); BEA
Cost of Living-Adjusted After-Tax Mean Income Per Household (2019)
Right to Work States $64,572
Forced-Unionism States $60,244
Source: Dept. of Commerce, Bureau of the Census (BOC); MERIC; Tax Foundation
Aggregate “Tax Freedom Day” (2019)
Right to Work States April 9
Forced-Unionism States April 22
Source: Tax Foundation; BEA
Growth in the Number of Residents Aged 35-54 (2011-2021)
Right to Work States 3.5%
Forced-Unionism States -4.2%
Source: BOC
Welfare (TANF) Recipients Per 1,000 Residents (CY 2021)
Right to Work States 2.5
Forced-Unionism States 8.1
Source: U.S. Admin. For Children and Families; BOC
Unfunded Liabilities Per Capita of Public Pension Plans (2021)
Right to Work States $18,157
Forced-Unionism States $31,914
Source: American Legislative Exchange Council
Percentage Growth in Real Household Consumption (2010-2020)
Right to Work States 22.3%
Forced-Unionism States 15.5%
Source: BEA
New Privately-Owned Single-Unit Housing Authorizations Per 1,000 Residents (CY 2021)
Right to Work States 4.8
Forced-Unionism States 1.8
Source: BOC


