
Fact Sheets
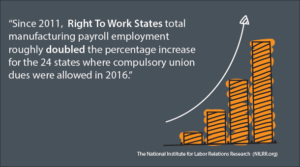
Economic Comparisons: Right To Work States versus Compulsory Unionism States
A Fact Sheet is typically in a quick read format regarding data, research and analysis provided by the staff of the National Insitute for Labor Relations Research (NILRR.org).

Right to Work Benefits Fact Sheet – Spring 2026
Spring 2026 Right to Work Benefits Fact Sheet available online. 2026 Spring Right to Work...

Right to Work Destruction Has Hurt Michigan Employees, Families
2026-April_Right to Work Destruction Has Hurt Michigan Employees, Families PublishedDownload In 2023, Gov. Gretchen Whitmer...

Right to Work Benefits Fact Sheet Winter 2026
Right To Work continues to free employees by helping protect choice and creating new opportunities....

Union Bosses Admit They Spent $1.8 Billion on Politics in the 2024 Election Cycle — The Real Number is Likely Over $28 Billion
Union-reported political spending from union dues-funded treasuries was up 8% since the last cycle. Click...

How Can Union-Boss Pillaging of Taxpayers Finally Be Stopped?
Time and Again, Gross Big Labor Abuses Are Publicly Exposed and Denounced, Without Being Remedied...

Why Right to Work States Outperform: Examining Employment Growth and Economic Benefits
https://youtu.be/XZqzAnhWgk0 Why Right to Work States Outperform: Examining Employment Growth and Economic Benefits When evaluating...

Breaking News: 2025 Fall NILRR Right to Work Benefits Fact Sheet
Right to Work states are crushing it economically! Freedom fuels prosperity! Download the 2025 Fall...

The 2025 Spring Right to Work Benefits Fact Sheet
Download the 2025 Spring Right to Work Benefits Fact Sheet The "Spring 2025 Right to...

